Double 7's StrategyStrategy described in the book "Short Term Trading Strategies that Work", written by Larry Connors and Cesar Alvarez.
It is the simplest strategy I know and has only 3 rules:
- Price must be above the arithmetic moving average of 200 periods.
- Buy when the price closes below the closing of the last 7 days.
- Sale when the price closes above the closing of the last 7 days.
Simple as it may seem, this strategy works very well in some stocks and/or graphical times (in some stocks it overcomes many RSI 2 strategies). It was developed for the daily chart and does not usually work well on weekly or monthly charts, but can be used for day trades if the back-test proves to be favorable.
If you want, you can change the input and output rules by setting other values for the input or output period and thus find more positive results for specific stocks.
There is no stop loss because in tests the stop loss usually reduces the gains of the strategy.
Good luck and good trades.
================================
Estrategia descrita no livro "Short Term Trading Strategies that Work", escrito por Larry Connors e Cesar Alvarez.
É a estratégia mais simples que eu conheço e tem apenas 3 regras:
- Preço deve estar acima da média móvel aritmética de 200 períodos.
- Compre quando o preço fechar abaixo do fechamento dos ultimos 7 dias.
- Venda quando o preço fechar acima do fechamento dos ultimos 7 dias.
Por mais simples que pareça, esta estratégia funciona muito bem em alguns papeis e/ou tempos gráficos (em alguns papeis a mesma supera muitas estratégias pelo IFR2). A mesma foi desenvolvida para o gráfico diário e normalmente não funciona muito bem em gráficos semanais ou mensais, mas pode ser utilizado no intraday caso o backtest se mostre favorável.
Caso você queira, é possível alterar a regra de entrada e saída definindo outros valores para o período de entrada ou saída e assim encontrar resultados mais positivos para cada papel.
Não existe stop loss pois nos testes normalmente o stop loss reduz os ganhos da estratégia.
Boa sorte e bons trades.
Cari dalam skrip untuk "the strat"

Combo Backtest 123 Reversal & Bull Power This is combo strategies for get a cumulative signal.
First strategy
This System was created from the Book "How I Tripled My Money In The
Futures Market" by Ulf Jensen, Page 183. This is reverse type of strategies.
The strategy buys at market, if close price is higher than the previous close
during 2 days and the meaning of 9-days Stochastic Slow Oscillator is lower than 50.
The strategy sells at market, if close price is lower than the previous close price
during 2 days and the meaning of 9-days Stochastic Fast Oscillator is higher than 50.
Second strategy
Bull Power Indicator
To get more information please see "Bull And Bear Balance Indicator"
by Vadim Gimelfarb.
WARNING:
- For purpose educate only
- This script to change bars colors.

Combo Backtest 123 Reversal & Bull And Bear Balance This is combo strategies for get a cumulative signal.
First strategy
This System was created from the Book "How I Tripled My Money In The
Futures Market" by Ulf Jensen, Page 183. This is reverse type of strategies.
The strategy buys at market, if close price is higher than the previous close
during 2 days and the meaning of 9-days Stochastic Slow Oscillator is lower than 50.
The strategy sells at market, if close price is lower than the previous close price
during 2 days and the meaning of 9-days Stochastic Fast Oscillator is higher than 50.
Second strategy
This new indicator analyzes the balance between bullish and
bearish sentiment.
One can cay that it is an improved analogue of Elder Ray indicator.
To get more information please see "Bull And Bear Balance Indicator"
by Vadim Gimelfarb.
WARNING:
- For purpose educate only
- This script to change bars colors.

Combo Backtest 123 Reversal & Breakout Range Short This is combo strategies for get a cumulative signal.
First strategy
This System was created from the Book "How I Tripled My Money In The
Futures Market" by Ulf Jensen, Page 183. This is reverse type of strategies.
The strategy buys at market, if close price is higher than the previous close
during 2 days and the meaning of 9-days Stochastic Slow Oscillator is lower than 50.
The strategy sells at market, if close price is lower than the previous close price
during 2 days and the meaning of 9-days Stochastic Fast Oscillator is higher than 50.
Second strategy
Breakout Range Short Strategy
WARNING:
- For purpose educate only
- This script to change bars colors.

MACD/EMA/SMA/Ichimoku Confluence StrategyThis strategy uses a number of chart indicators to provide a Bullish/Bearish signal. Using a combination of the 200 SMA, the 20 EMA, the MACD and the Ichimoku cloud, the strategy logic will adjust the amount of confluence required between the indicators depending on how bullish or bearish the chart is looking. The logic looks for the following:
- Are we above or below the 200 SMA?
- Are we above or below the 20 EMA?
- Have we had a bullish MACD cross?
- Where are we in relation to the Ichimoku cloud?
If the coin is below the 200 SMA, then the strategy will only give a buy signal if the coin closes a candle above the 20 EMA AND the MACD is bullish and either the Ichimoku cloud is green, or the coin is above the Ichimoku cloud (regardless of colour).
If the coin is above the 200 SMA, Then the strategy will give a buy signal if the coin closes a candle above the 20 EMA AND the MACD is bullish and the coin is either IN the cloud (not necessarily above it) or the cloud is green.
The reverse is true for a sell signal, i.e. when the coin is above the 200 SMA it must close a candle below the Ichimoku cloud and be bearish in relation to the 20 EMA and MACD. If it is below the 200 SMA, then the strategy will give a sell signal if the the EMA/MACD conditions are true and the coin enters the cloud.
This strategy gives a fairly conservative signal for entry and exit points, but is fairly successful across a number of time frames, both short term and long term. As with all my strategies, I only include LONG entries and closes, not SHORT entries (as I find they make for inaccurate backtesting).
Please feel free to like, share, critique and suggest any improvements to this strategy. All feedback, positive and negative, is appreciated.

Combo Backtest 123 Reversal & Breakout Range Long This is combo strategies for get a cumulative signal.
First strategy
This System was created from the Book "How I Tripled My Money In The
Futures Market" by Ulf Jensen, Page 183. This is reverse type of strategies.
The strategy buys at market, if close price is higher than the previous close
during 2 days and the meaning of 9-days Stochastic Slow Oscillator is lower than 50.
The strategy sells at market, if close price is lower than the previous close price
during 2 days and the meaning of 9-days Stochastic Fast Oscillator is higher than 50.
Second strategy
Breakout Range Long Strategy
WARNING:
- For purpose educate only
- This script to change bars colors.

Combo Backtest 123 Reversal & Bill Williams. AO with Signal Line This is combo strategies for get a cumulative signal.
First strategy
This System was created from the Book "How I Tripled My Money In The
Futures Market" by Ulf Jensen, Page 183. This is reverse type of strategies.
The strategy buys at market, if close price is higher than the previous close
during 2 days and the meaning of 9-days Stochastic Slow Oscillator is lower than 50.
The strategy sells at market, if close price is lower than the previous close price
during 2 days and the meaning of 9-days Stochastic Fast Oscillator is higher than 50.
Second strategy
This indicator plots the oscillator as a histogram where blue denotes
periods suited for buying and red . for selling. If the current value
of AO (Awesome Oscillator) is above previous, the period is considered
suited for buying and the period is marked blue. If the AO value is not
above previous, the period is considered suited for selling and the
indicator marks it as red.
You can make changes in the property for set calculating strategy MA, EMA, WMA
WARNING:
- For purpose educate only
- This script to change bars colors.

RSI-RENKO Divine Strategy (Backtesting)Live, non-repainting strategy using RENKO and RSI mixed together to multiple types of long and short positions.
- Features -
Live entry direction with trade warnings and alerts
Live trade building buy and sell limits (for buy/sell limits)
Entry location icons as well as pyramid entries (to add to existing position)
Swing trades that keep you in the trade for the maximum possible profit
1 scalp target based on the RSI settings and entry location
Dynamic trailing stop for swings and scalps
Alert conditions for every update and condition change of the strategy (Provided by indicator study)
4 pre-built color themes, including candlestick coloring
This strategy is best used with the companion indicators: Renko RSI and Renko Trend Momentum using the identical RSI and Trend settings.
The linked script is identical and used solely for alerts, because Trading View still after 3 years of requesting does not provide the ability to use alert conditions inside a strategy script, only an indicator script. This strategy should be used to backtest your settings.
The approach to this strategy uses several parallel trades of different types. In order to generate multiple trade types the "pyramid trades" setting of the strategy (second tab of the settings that lets you adjust the number of pyramid contracts) should be used.
- Trade Types -
Swing: This trade is entered on the solid arrows after the RSI has become oversold or overbought. It is key that all trades wait for some degree of pullback before entering, even after the trend flips between positive and negative. This trade is held until stopped out or an opposite trade is triggered that reverses the position.
Scalp: These trades have a limit buy/sell entry and a target. The initial target is the opposing RSI overbought or oversold level and changes in real time.
Turning on/off the different trade types (strategy only) is simple done by decreasing the number of contracts used for that trade type to zero. When the quantity is set to zero, that trade is not considered.
- Session -
The session filter is used to narrow trade executions by only allowing trades that are inside the session boundaries. This can be used to isolate the London or New York session for example. The default is 24 x 7 which filters no trades (Trading View has a bug when resetting this, so simply reset the indicator to get it back to 24x7).
Please see the following 3 videos introducing the concept of this strategy.
All feature requests or bug reports are welcome either by direct messaging or comments on this page or the linked indicator page.
Please PM for access. Cheers.

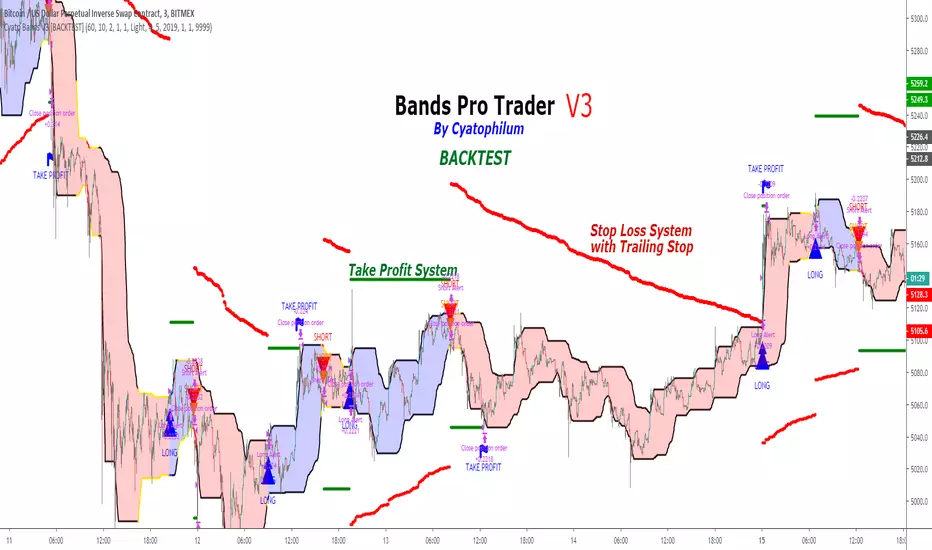
Cyatophilum Bands Pro Trader V3 [BACKTEST]An Original Automated Strategy that can be used for Manual or Bot Trading, on any timeframe and market.
>> Presentation <<
How it works
No, these are NOT Bollinger Bands..
The Cyatophilum Bands are an original formula that I created. You will probably never find it anywhere else.
Their behavior is the following:
When they are horizontal it means the trend is going sideways and they represent supports (lower band) and resistances (upper band).
When they are climbing or falling it means the trend is either bullish or bearish and they represent Trend Lines.
The strategy enters Long on a Bull Breakout and enters Short on a Bear Breakout.
The exits are triggered either on a Trend Reversal, a Stop Loss or a Take Profit.
FEATURES
Take Profit System
Stop Loss System
Show Net profit Line
More features here
Finding a profitable configuration is GUARANTEED
0. Choose your symbol and timeframe. Then add the Backtest version to your chart. If at any time you decide to change your timeframe, go back to step 1.
1. Open the strategy tester and look at the buy & hold line.
If it is mostly climbing (last value greater than 0) then it means we are in a bull market. You should then opt or a long only strategy.
If it is mostly dropping (last value lower than 0) then it means we are in a bear market. You should then opt or a short only strategy.
Note : This first step is really important. Trading against the market has very little chances to succeed.
2. Go into the Strategy Input Parameters:
check "Enable Long Results" and uncheck "Enable Short Results" if you are in a long only strategy.
check "Enable Short Results" and uncheck "Enable Long Results" if you are in a short only strategy.
3. Open the Strategy Tester and open the Strategy Properties.
We are going to find the base parameters for the Bands.
The "Bands Lookback" is the main parameter to configure for any strategy. It corresponds to how strong of a support and resistance the bands will behave. The lower the timeframe, the higher lookback you will need. It can move from 10 to 60. For example 60 is a good value for a 3 minute timeframe. Try different values, and look at the "net profit" value in the Overview tab of the Strategy Tester. Keep the Lookback value that shows the best net profit value.
Then play with the "Bands Smoothing" from 2 to 20 and keep the best net profit value.
The "Band Smoothing" is used to reduce noise.
Usually, the default value (10) is what gives the best results.
From this point you should already be able to have a profitable strategy (net profit>0), but we can improve it using the Stop Loss and the Take Profit feature.
4. To activate the Stop Loss feature, click on the "SECURITY" checkbox
You should see horizontal red lines appear.
A Long/short exit alert will be triggered if the price were to cross this line. (A red Xcross will appear)
Choose the Stop Loss percentage.
On top of that, you can enable the feature "Trailing Stop". It will make the red line follow the price, at a speed that you can configure with the "Trailing Speed" parameter.
Now, sometimes a stop is triggered and it was just a fakeout. You can enable "Re-entries after a stop" to avoid missing additional opportunities.
5. To activate the Take Profit feature, click on the "TAKE PROFIT" checkbox
You should see horizontal green lines appear.
A Long/short exit alert will be triggered if the price were to cross this line. (A flag will appear)
Choose the Take Profit percentage.
A low takeprofit will provide a safer strategy but can reduce potential profits.
A higher takeprofit will increase risk but can provide higher potential profits.
6. Money Management
You can configure the backtest according to your own money management.
Let's say you have 10 000 $ as initial capital and want to trade only 5%, set the Order Size to 5% of Equity.
You can increase net profit by increasing the order size but this is at your own risk.
How to create alerts explained here
Sample Uses Cases
Use it literally anywhere
This indicator can be used on any timeframe and market (not only cryptocurrencies).
About the Backtest below
The Net Profit (Gross profit - Gross loss) is calculated with a commission of 0.05% on each order.
No leverage used. This is a long strategy.
Each trade is made with 10 % of equity from an inital capital of 10 000$. The net profit can be bigger by increasing the % of equity but this a trader's rule to minimise the risk.
I am selling access to all my indicators on my website : blockchainfiesta.com
To get a 2 days free trial, just leave a comment , thanks !
Join my Discord for help, configurations, requests, etc. discord.gg
Bollinger_Bands_Strategy(Add Function) - BB Free (By Wolf)전략 및 지표 얼러트등 파인스크립트 제작 문의 - 트레이딩뷰 메시지
Contact to create strategy and indicators add alert etc - TradingView Message
이름(Name)
Bollinger Bands Strategy (Add Function) (By Wolf)
-해당 전략은 Long & Short 의 신호를 발생시키는 전략입니다.
-The strategy is to generate a signal from Long & Short
기능 추가(Add Function)
-Trade Direction Long
-Trade Direction Short
-Stoploss ($)
-Profit target($)
-Backtest date
해당 전략은 수익률이 높은값으로 임의로 변경해놓았습니다
본인의 투자전략에 맞는 수치로 변경하여 사용하셔도 좋습니다.
*I entered the value with good profits settings for the strategy.
You can use this customarily
소스코드(Source code)
-비공개 (not open to the public)
*모든 전략은 리페인트 코드를 등록하지않았습니다.
-All strategies do not register the repaint code
*모든 전략 및 지표의 백테스트 결과는 BITMEX Fee 0.075% 를 입력한 결과값입니다.
-The back test result for all strategies and indicators is the result of inputting BITEX Fee 0.075%
*모든 거래는 높은 위험을 수반하며, 과거 백테스트 결과가 반드시 현재 및 미래의 결과를 나타내는것은 아닙니다.
가상 또는 시뮬레이션 백테스트 결과는 한계를 가지고 있으며 실제거래와 시장의 변동 및 유동에 따라 똑같지않을
가능성이있으며, 모든 손실에 대한 책임은 본인에게 있습니다.
-All trade involve high risk, and past backtest results do not necessarily represent current and future results.
Virtual or simulated backtest results have limitations and are not consistent with actual transactions and market changes and flows
It is possible and you are responsible for any loss.

Reversal Bar Signal TestReversal Bars are simple indicators I draw on modified uni renko bars. These simply indicates the bars that "can be" a sign of a reversal or at least a retrace in trend.
This is a test with a simple strategy to buy and sell on those reversal signals.
Keep in mind, all the strategies I am providing are single tool being tested. My methodology is a combination of all these tools with the concept being that if each tool can give good result in testing, the synergistic combination will be something that you wouldn't find anywhere else.
Please don't contact me about getting access to these strategies. These strategies are being developed for my students only.
Right now, the English version of website and learning material is under development, as soon as they are ready, there will be comments bellow every single one of the tool set related.

XPloRR MA-Trailing-Stop StrategyXPloRR MA-Trailing-Stop Strategy
Long term MA-Trailing-Stop strategy with Adjustable Signal Strength to beat Buy&Hold strategy
None of the strategies that I tested can beat the long term Buy&Hold strategy. That's the reason why I wrote this strategy.
Purpose: beat Buy&Hold strategy with around 10 trades. 100% capitalize sold trade into new trade.
My buy strategy is triggered by the fast buy EMA (blue) crossing over the slow buy SMA curve (orange) and the fast buy EMA has a certain up strength.
My sell strategy is triggered by either one of these conditions:
the EMA(6) of the close value is crossing under the trailing stop value (green) or
the fast sell EMA (navy) is crossing under the slow sell SMA curve (red) and the fast sell EMA has a certain down strength.
The trailing stop value (green) is set to a multiple of the ATR(15) value.
ATR(15) is the SMA(15) value of the difference between the high and low values.
The scripts shows a lot of graphical information:
The close value is shown in light-green. When the close value is lower then the buy value, the close value is shown in light-red. This way it is possible to evaluate the virtual losses during the trade.
the trailing stop value is shown in dark-green. When the sell value is lower then the buy value, the last color of the trade will be red (best viewed when zoomed)(in the example, there are 2 trades that end in gain and 2 in loss (red line at end))
the EMA and SMA values for both buy and sell signals are shown as a line
the buy and sell(close) signals are labeled in blue
How to use this strategy?
Every stock has it's own "DNA", so first thing to do is tune the right parameters to get the best strategy values voor EMA , SMA, Strength for both buy and sell and the Trailing Stop (#ATR).
Look in the strategy tester overview to optimize the values Percent Profitable and Net Profit (using the strategy settings icon, you can increase/decrease the parameters)
Then keep using these parameters for future buy/sell signals only for that particular stock.
Do the same for other stocks.
Important : optimizing these parameters is no guarantee for future winning trades!
Here are the parameters:
Fast EMA Buy: buy trigger when Fast EMA Buy crosses over the Slow SMA Buy value (use values between 10-20)
Slow SMA Buy: buy trigger when Fast EMA Buy crosses over the Slow SMA Buy value (use values between 30-100)
Minimum Buy Strength: minimum upward trend value of the Fast SMA Buy value (directional coefficient)(use values between 0-120)
Fast EMA Sell: sell trigger when Fast EMA Sell crosses under the Slow SMA Sell value (use values between 10-20)
Slow SMA Sell: sell trigger when Fast EMA Sell crosses under the Slow SMA Sell value (use values between 30-100)
Minimum Sell Strength: minimum downward trend value of the Fast SMA Sell value (directional coefficient)(use values between 0-120)
Trailing Stop (#ATR): the trailing stop value as a multiple of the ATR(15) value (use values between 2-20)
Example parameters for different stocks (Start capital: 1000, Order=100% of equity, Period 1/1/2005 to now) compared to the Buy&Hold Strategy(=do nothing):
BEKB(Bekaert): EMA-Buy=12, SMA-Buy=44, Strength-Buy=65, EMA-Sell=12, SMA-Sell=55, Strength-Sell=120, Stop#ATR=20
NetProfit: 996%, #Trades: 6, %Profitable: 83%, Buy&HoldProfit: 78%
BAR(Barco): EMA-Buy=16, SMA-Buy=80, Strength-Buy=44, EMA-Sell=12, SMA-Sell=45, Strength-Sell=82, Stop#ATR=9
NetProfit: 385%, #Trades: 7, %Profitable: 71%, Buy&HoldProfit: 55%
AAPL(Apple): EMA-Buy=12, SMA-Buy=45, Strength-Buy=40, EMA-Sell=19, SMA-Sell=45, Strength-Sell=106, Stop#ATR=8
NetProfit: 6900%, #Trades: 7, %Profitable: 71%, Buy&HoldProfit: 2938%
TNET(Telenet): EMA-Buy=12, SMA-Buy=45, Strength-Buy=27, EMA-Sell=19, SMA-Sell=45, Strength-Sell=70, Stop#ATR=14
NetProfit: 129%, #Trade

Hull MA-X + Ichimoku Kinko Hyo StrategyHull MA-X:
The Hull MA involves the weighted moving average ( WMA ) in its calculation.
First, calculate the WMA with period (n / 2) and multiply this by 2. Remember ‘n’ is the time period configurable based on the trader’s requirement.
Second, calculate the WMA for period “n” and subtract if from the first step. Thirdly, calculate the weighted moving average with period sqrt (n) using the data from the second step. You can take a look at the below formula:
Hull MA= WMA (2*WMA (n/2) − WMA (n)), sqrt (n))
The default setting is 12 periods in this strategy, fast Hull MA crossing slow Hull MA will generate a circle on charts.
Ichimoku Kinko Hyo:
The Ichimoku Kinko Hyo system includes five kinds of signal, of which this strategy uses four signals i.e. Tenkan Sen / Kijun Sen Cross, price crosses the Kijun Sen, Chikou Span and Kumo. Although the Chikou Span, Senkou Span A and Senkou Span B (Kumo) are shifted into the past/future, these trigger signals enhances the strategy.
The Tenkan Sen, also known as the Turning or Conversion line, is a moving average of the highest high and lowest low over the last 9 periods in this strategy.
The Kijun Sen, also known as the Standard or Base line, is a moving average of the highest high and lowest low over the last 24 periods in this strategy.
The Chikou Span, also known as the Lagging line, is the closing price plotted 24 periods behind in this strategy.
The Senkou Span A, also known as the 1st leading line, is a moving average of the Tenkan Sen and Kijun Sen and is plotted 24 periods ahead in this strategy.
The Senkou Span B, also known as the 2nd leading line, is a moving average of the highest high and lowest low over the last 51 trading days is plotted 24 periods ahead in this strategy.
As with most technical analysis methods, Ichimoku is likely to produce frequent conflicting signals in non-trending markets, So in addition to Ichimoku Kinko Hyo, the Hull MA is used, which is popular amongst some day traders, in combination it attempts to give an accurate signal by eliminating lags and improving the smoothness of the line.
The Hull MA Cross in combination with Ichimoku Kinko Hyo signals tries to give an accurate signal by eliminating lags and improve the smoothness of price activity. Please note that price trends can and do change often, so your readings of the charts and this trading system should be probabilistic, rather than predictive.
Ichimoku Kinko Hyo + HULL-MA_X + MacDThe Ichimoku Kinko Hyo system includes five kinds of signal, of which this strategy uses the most recent of ones i.e. Tenkan Sen / Kijun Sen Cross and price crosses the Kijun Sen. As the Chikou Span, Senkou Span A and Senkou Span B are shifted into the past/future, the trigger signals will be only be used for visual confirmation and not part of the strategy.
The Tenkan Sen, also known as the Turning or Conversion line, is a moving average of the highest high and lowest low over the last 9 periods in this strategy.
The Kijun Sen, also known as the Standard or Base line, is a moving average of the highest high and lowest low over the last 24 periods in this strategy.
The Chikou Span, also known as the Lagging line, is the closing price plotted 24 periods behind in this strategy.
The Senkou Span A, also known as the 1st leading line, is a moving average of the Tenkan Sen and Kijun Sen and is plotted 24 periods ahead in this strategy.
The Senkou Span B, also known as the 2nd leading line, is a moving average of the highest high and lowest low over the last 51 trading days is plotted 24 periods ahead in this strategy.
Moving average convergence divergence (MaCD) is a trend-following momentum indicator that shows the relationship between two moving averages of prices. The MaCD is calculated in this strategy by subtracting the 24-day exponential moving average (EMA) from the 12-day EMA. A nine-day EMA of the MACD, called the "signal line", aMaCD in this case, is then plotted on top of the MaCD. In this strategy, MaCD/ aMaCD Cross is functioning as a trigger for buy and sell signals.
As with most technical analysis methods, Ichimoku is likely to produce frequent conflicting signals in non-trending markets, So in addition to Ichimoku Kinko Hyo, the Hull MA is popular amongst some day traders, as the indicator which in combination with MaCD attempts to give an accurate signal by eliminating lags and improving the smoothness of the line.
Alan Hull, developed this moving average indicator and hence it’s called the Hull MA.
Now, let’s dissect how the Hull moving average is calculated.
The Hull MA involves the weighted moving average (WMA) in its calculation.
First, calculate the WMA with period (n / 2) and multiply this by 2. Remember ‘n’ is the time period configurable based on the trader’s requirement. The default setting is 12 periods in this strategy, fast Hull MA crossing slow Hull MA will generate a circle on charts.
Second, calculate the WMA for period “n” and subtract if from the first step. Thirdly, calculate the weighted moving average with period sqrt (n) using the data from the second step. You can take a look at the below formula:
Hull MA= WMA (2*WMA (n/2) − WMA (n)), sqrt (n))
The Hull MA Cross in combination with Tenkan Sen / Kijun Sen Cross and MaCD tries to give an accurate signal by eliminating lags and improve the smoothness of price activity. Please note that price trends can and do change often, so your readings of the charts and this trading system should be probabilistic, rather than predictive.

High Risk S&P 500 Buy The Dip Strategy, Albireo (by ChartArt)This strategy which has no stop loss and therefore is a high risk strategy, goes long as soon as the "S&P 500" on "OANDA" or "FXCM" starts a downtrend. A Bollinger Band filters the more extreme downtrends. The Bollinger Band setting can be changed to filter selectively for even more severe price declines or to allow more trades by setting the standard deviation to a lower value.
This "S&P 500" strategy only correctly works as intended on "OANDA" or "FXCM" (with default setting "OANDA"), because "OANDA" or "FXCM" are the only two price sources allowed in the strategy.
If you don't want to lose all your money due to some random strategy you found on the Internet, here is a warning:
All trading involves high risk; past performance is not necessarily indicative of future results.
P.S. Here are more trade examples, which help to explain why I named this a high risk strategy:

Lazy MomentumLazy Momentum Strategy is a trend trading strategy. There are 3 steps in the strategy:
1. Identify trend
2. Momentum Signal
3. Money management

Strategy Code Example - Risk Management*** THIS IS JUST AN EXAMPLE OF STRATEGY RISK MANAGEMENT CODE IMPLEMENTATION ***
For my own future reference, and for anyone else who needs it.
Pine script strategy code can be confusing and awkward, so I finally sat down and had a little think about it and put something together that actually works (i think...)
Code is commented where I felt might be necessary (pretty much everything..) and covers:
Take Profit
Stop Loss
Trailing Stop
Trailing Stop Offset
...and details how to handle the input values for these in a way that allows them to be disabled if set to 0, without breaking the strategy.exit functionality or requiring a silly amount of statement nesting.
Also shows how to use functions (or variables/series) to execute trade entries and exits.
Cheers!

Everyday 0003 _ MAC Pullback I recently posted a Moving Averge Crossover strategy for my Everyday project - a project I've given myself where I try to create one strategy everyday in between 15 minutes and 2 hours.
In the comments of my last published idea, user SignalTradersUK was very kind and suggested I try the following in my next study:
"i think your next study should be, to workout what to do after the Moving Average cross! If you look just on the chart you have posted, Price would appear to always come back to the levels where the 2 MA's cross and then go back in the direction of the crossing of the MA's. It's a great pull back strategy."
I'm really just beginning to learn about coding strategies so I'm not 100% sure I correctly understood his suggestion.
I admit I had difficulties wrapping my head around how to do this.
Anyway, the result is a strategy which runs alongside the main Moving Average Crossover.
'The Algorithm'
When the fast and slow MA cross the strategy traces back 40 days to find a swing low.
This swing low and the price at the MA cross is used to calculate a fib 1.272 extension.
The price at this 1.272 extension is used to place a Pullback short order.
Since we're shorting a bull trend, a tight stop is used.
If the pullback reaches down to the fib 0.618 we take profit (close the short).
Like I said, I don't know if I correctly understood SignalTradersUK feedback, but I really appreciate the
feedback and advice!
As always I'm hoping to learn from the community, so all feedback, corrections and advice is very welcome!
Thanks!
/pbergden

Outsidebar vs Insidebar, Illusion Strategy (by ChartArt)WARNING: This strategy does not work! Please don't trade with this strategy
I'm sharing this strategy for the following three educational reasons:
1. You can easily find 100% strategies, but if they only seem to work 100% on one asset, they actually don't work at all. Therefore never backtest your strategy only on one asset, especially forward testing is useless, because it tends to repeat the old patterns. Your strategy has to work on as many different assets as possible.
2. The pyramiding of orders can have an impact on the strategy. In this case if you manually change the strategy settings by increasing it from 1 to 100 pyramiding orders changes the percent profitable on "UKOIL" monthly from 100% to 90% profitable. On other assets you can see very different results. Allowing much more pyramiding orders in this case results in opening orders where the background color highlights appear.
3. The Tradingview backtest beta version currently does not close the last open trade during the backtest. In this case going long on "UKOIL" near the top in 2011 as this strategy did would result in a big loss in 2015. But since the trade is still open and not canceled out by a new short order it still appears as if this strategy works 100% profitable. Which it doesn't.

[AutoView] MovingAvg Cross - Video AttachedThere is nothing special or spectacular about this script. It's your standard Moving Average Cross Strategy. It is actually a built in script everyone has access to already. I only changed some of the settings and flipped the orders.
The reason I actually published this, is because people have been asking me what the best way to find the best settings for a strategy. So I made a YouTube video showing people how I personally do it. I took this built in strategy and within 5 minutes took it from a net profit loss and profit factor of 0.5 to a net profit win with a profit factor of 3-5.
Of course this is only on the 1 minute candles, so forward testing the strategy is a must as I do not recommend straight up taking this and trading it.
You can watch the video here:
www.youtube.com
Hope this helps everyone speed up their back testing and fine tuning their strategies.

US Market Long Horizon Momentum Summary in one paragraph
US Market Long Horizon Momentum is a trend following strategy for US index ETFs and futures built around a single eighteen month time series momentum measure. It helps you stay long during persistent bull regimes and step aside or flip short when long term momentum turns negative.
Scope and intent
• Markets. Large cap US equity indices, liquid US index ETFs, index futures
• Timeframes. 4h/ Daily charts
• Default demo used in the publication. SPY on 4h timeframe chart
• Purpose. Provide a minimal long bias index timing model that can reduce deep drawdowns and capture major cycles without parameter mining
• Limits. This is a strategy. Orders are simulated on standard candles only
Originality and usefulness
• Unique concept or fusion. One unscaled multiple month log return of an external benchmark symbol drives all entries and exits, with optional volatility targeting as a single risk control switch.
• Failure mode addressed. Fully passive buy and hold ignores the sign of long horizon momentum and can sit through multi year drawdowns. This script offers a way to step down risk in prolonged negative momentum without chasing short term noise.
• Testability. All parameters are visible in Inputs and the momentum series is plotted so users can verify every regime change in the Tester and on price history.
• Portable yardstick. The log return over a fixed window is a unit that can be applied to any liquid symbol with daily data.
Method overview in plain language
The method looks at how far the benchmark symbol has moved in log return terms over an eighteen month window in our example. If that long horizon return is positive the strategy allows a long stance on the traded symbol. If it is negative and shorts are enabled the strategy can flip short, otherwise it goes flat. There is an optional realised volatility estimate on the traded symbol that can scale position size toward a target annual volatility, but in the default configuration the model uses unit leverage and only the sign of momentum matters.
Base measures
Return basis. The core yardstick is the natural log of close divided by the close eighteen months ago on the benchmark symbol. Daily log returns of the traded symbol feed the realised volatility estimate when volatility targeting is enabled.
Components
• Component one Momentum eighteen months. Log of benchmark close divided by its close mom_lookback bars ago. Its sign defines the trend regime. No extra smoothing is applied beyond the long window itself.
• Component two Realised volatility optional. Standard deviation of daily log returns on the traded symbol over sixty three days. Annualised by the square root of 252. Used only when volatility targeting is enabled.
• Optional component Volatility targeting. Converts target annual volatility and realised volatility into a leverage factor clipped by a maximum leverage setting.
Fusion rule
The model uses a simple gate. First compute the sign of eighteen month log momentum on the benchmark symbol. Optionally compute leverage from volatility. The sign decides whether the strategy wants to be long, short, or flat. Leverage only rescales position size when enabled and does not change direction.
Signal rule
• Long suggestion. When eighteen month log momentum on the benchmark symbol is greater than zero, the strategy wants to be long.
• Short suggestion. When that log momentum is less than zero and shorts are allowed, the strategy wants to be short. If shorts are disabled it stays flat instead.
• Wait state. When the log momentum is exactly zero or history is not long enough the strategy stays flat.
• In position. In practice the strategy sits IN LONG while the sign stays positive and flips to IN SHORT or flat only when the sign changes.
Inputs with guidance
Setup
• Momentum Lookback (months). Controls the horizon of the log return on the benchmark symbol. Typical range 6 to 24 months. Raising it makes the model slower and more selective. Lowering it makes it more reactive and sensitive to medium term noise.
• Symbol. External symbol used for the momentum calculation, SPY by default. Changing it lets you time other indices or run signals from a benchmark while trading a correlated instrument.
Logic
• Allow Shorts. When true the strategy will open short positions during negative momentum regimes. When false it will stay flat whenever momentum is negative. Practical setting is tied to whether you use a margin account or an ETF that supports shorting.
Internal risk parameters (not exposed as inputs in this version) are:
• Target Vol (annual). Target annual volatility for volatility targeting, default 0.2.
• Vol Lookback (days). Window for realised volatility, default 63 trading days.
• Max Leverage. Cap on leverage when volatility targeting is enabled, default 2.
Usage recipes
Swing continuation
• Signal timeframe. Use the daily chart.
• Benchmark symbol. Leave at SPY for US equity index exposure.
• Momentum lookback. Eighteen months as a default, with twelve months as an alternative preset for a faster swing bias.
Properties visible in this publication
• Initial capital. 100000
• Base currency. USD
• Default order size method. 5% of the total capital in this example
• Pyramiding. 0
• Commission. 0.03 percent
• Slippage. 3 ticks
• Process orders on close. On
• Bar magnifier. Off
• Recalculate after order is filled. Off
• Calc on every tick. Off
• All request.security calls use lookahead = barmerge.lookahead_off
Realism and responsible publication
The strategy is for education and research only. It does not claim any guaranteed edge or future performance. All results in Strategy Tester are hypothetical and depend on the data vendor, costs, and slippage assumptions. Intrabar motion is not modeled inside daily bars so extreme moves and gaps can lead to fills that differ from live trading. The logic is built for standard candles and should not be used on synthetic chart types for execution decisions.
Performance is sensitive to regime structure in the US equity market, which may change over time. The strategy does not protect against single day crash risk inside bars and does not model gap risk explicitly. Past behavior of SPY and the momentum effect does not guarantee future persistence.
Honest limitations and failure modes
• Long sideways regimes with small net change over eighteen months can lead to whipsaw around the zero line.
• Very sharp V shaped reversals after deep declines will often be missed because the model waits for momentum to turn positive again.
• The sample size in a full SPY history is small because regime changes are infrequent, so any test must be interpreted as indicative rather than statistically precise.
• The model is highly dependent on the chosen lookback. Users should test nearby values and validate that behavior is qualitatively stable.
Legal
Education and research only. Not investment advice. You are responsible for your own decisions. Always test on historical data and in simulation with realistic costs before any live use.

Momentum FlowThis is a rule-based, fully automated trading strategy** developed **exclusively for BANKNIFTY** and optimized strictly for the **2-Hour (2H) timeframe**. The system is designed to identify **high-quality directional opportunities** while filtering out low-probability market noise.
The strategy is built for traders who prefer:
* Clean positional trading
* Limited, high-quality signals
* Fully mechanical execution
* No discretionary decision-making
This system is **locked by design** and will **only operate on BANKNIFTY – 2H timeframe** to preserve performance integrity. Usage on any other symbol or timeframe is intentionally restricted.
---
### ✅ SUITABLE FOR:
* Positional traders
* Swing traders
* Working professionals
* Traders seeking structured, disciplined systems
---
### ❌ NOT SUITABLE FOR:
* Scalping
* Low-timeframe trading
* High-frequency setups
* Traders seeking daily signals
---
### ⚠️ IMPORTANT DISCLAIMER:
This strategy is provided strictly for **educational and research purposes only**. Trading in financial markets involves significant risk, and losses are possible. Past performance does not guarantee future results. The creator is not responsible for any financial losses incurred by the use of this strategy. Always trade with proper risk management.
---

Options Scalper v2 - SPY/QQQHere's a comprehensive description of the Options Scalper v2 strategy:
---
## Options Scalper v2 - SPY/QQQ
### Overview
A multi-indicator confluence-based scalping strategy designed for trading SPY and QQQ options on short timeframes (1-5 minute charts). The strategy uses a scoring system to generate high-probability CALL and PUT signals by requiring alignment across multiple technical indicators before triggering entries.
---
### Core Logic
The strategy operates on a **scoring system (0-9 points)** where both bullish (CALL) and bearish (PUT) conditions are evaluated independently. A signal only fires when:
1. A recent EMA crossover occurred (within the last 3 bars)
2. The direction's score meets the minimum threshold (default: 4 points)
3. The signal's score is higher than the opposite direction
4. Enough bars have passed since the last signal (cooldown period)
5. Price action occurs during valid trading sessions
---
### Indicators Used
| Indicator | Purpose | CALL Condition | PUT Condition |
|-----------|---------|----------------|---------------|
| **9/21 EMA Cross** | Primary trigger | Fast EMA crosses above slow | Fast EMA crosses below slow |
| **200 EMA** | Trend filter | Price above 200 EMA | Price below 200 EMA |
| **RSI (14)** | Momentum filter | RSI between 45-65 | RSI between 35-55 |
| **VWAP** | Institutional level | Price above VWAP | Price below VWAP |
| **MACD (12,26,9)** | Momentum confirmation | MACD line > Signal line | MACD line < Signal line |
| **Stochastic (14,3)** | Overbought/Oversold | Oversold or K > D | Overbought or K < D |
| **Volume** | Participation confirmation | Spike on green candle | Spike on red candle |
| **Price Structure** | Breakout detection | Higher high formed | Lower low formed |
---
### Scoring Breakdown
**CALL Score (Max 9 points):**
- Recent EMA cross up: +2 pts
- EMA alignment (fast > slow): +1 pt
- RSI in bullish range: +1 pt
- Above VWAP: +1 pt
- MACD bullish: +1 pt
- Volume spike on green candle: +1 pt
- Stochastic setup: +1 pt
- Above 200 EMA: +1 pt
- Breaking higher high: +1 pt
**PUT Score (Max 9 points):**
- Recent EMA cross down: +2 pts
- EMA alignment (fast < slow): +1 pt
- RSI in bearish range: +1 pt
- Below VWAP: +1 pt
- MACD bearish: +1 pt
- Volume spike on red candle: +1 pt
- Stochastic setup: +1 pt
- Below 200 EMA: +1 pt
- Breaking lower low: +1 pt
---
### Risk Management
The strategy uses **ATR-based dynamic stops and targets**:
| Parameter | Default | Description |
|-----------|---------|-------------|
| Stop Loss | 1.5x ATR | Distance below entry for longs, above for shorts |
| Take Profit | 2.0x ATR | Creates a 1:1.33 risk-reward ratio |
Positions are also closed on:
- Opposite direction signal (flip trade)
- Take profit or stop loss hit
---
### Session Filtering
Trades are restricted to high-liquidity periods by default:
- **Morning Session:** 9:30 AM - 11:00 AM EST
- **Afternoon Session:** 2:30 PM - 3:55 PM EST
This avoids choppy midday price action and captures the highest volume periods.
---
### Input Parameters
| Parameter | Default | Description |
|-----------|---------|-------------|
| Fast EMA | 9 | Fast moving average period |
| Slow EMA | 21 | Slow moving average period |
| Trend EMA | 200 | Long-term trend filter |
| RSI Length | 14 | RSI calculation period |
| RSI Overbought | 65 | Upper RSI threshold |
| RSI Oversold | 35 | Lower RSI threshold |
| Volume Multiplier | 1.2x | Volume spike detection threshold |
| Min Signal Strength | 4 | Minimum score required to trigger |
| Crossover Lookback | 3 | Bars to consider crossover "recent" |
| Min Bars Between Signals | 5 | Cooldown period between signals |
---
### Visual Elements
**Chart Plots:**
- Green line: 9 EMA (fast)
- Red line: 21 EMA (slow)
- Gray line: 200 EMA (trend)
- Purple dots: VWAP
**Signal Markers:**
- Green triangle up + "CALL" label: Buy call signal
- Red triangle down + "PUT" label: Buy put signal
- Small circles: EMA crossover reference points
**Info Table (Top Right):**
- Real-time CALL and PUT scores
- RSI, MACD, Stochastic values
- VWAP and 200 EMA position
- Recent crossover status
- Current signal state
---
### Alerts
| Alert Name | Trigger |
|------------|---------|
| CALL Entry | Standard call signal fires |
| PUT Entry | Standard put signal fires |
| Strong CALL | Call signal with score ≥ 6 |
| Strong PUT | Put signal with score ≥ 6 |
---
### Recommended Usage
| Setting | 0DTE Scalping | Intraday Swings |
|---------|---------------|-----------------|
| Timeframe | 1-2 min | 5 min |
| Min Signal Strength | 5-6 | 4 |
| ATR Stop Mult | 1.0 | 1.5 |
| ATR TP Mult | 1.5 | 2.0 |
| Option Delta | 0.40-0.50 | 0.30-0.40 |
---
### Key Improvements Over v1
1. **Requires actual crossover** - Eliminates false signals from simple trend continuation
2. **Balanced scoring** - Both directions evaluated equally, highest score wins
3. **Signal cooldown** - Prevents overtrading with minimum bar spacing
4. **Multi-indicator confluence** - 8 factors must align for signal generation
5. **Volume-candle alignment** - Volume spikes only count when matching candle direction
---
### Disclaimer
This strategy is for educational purposes. Backtest thoroughly before live trading. Options trading involves significant risk of loss. Past performance does not guarantee future results.
